There are a lot of odd statistics out there to read. It's impossible to know all of the information out there in the world, but there are so many informative and handy infographics online to see and learn from. The abundance of information out there can be overwhelming, and sometimes people don't have the time to educate themselves fully on a topic, so quick and simple infographics can be helpful.
Infographics are a fun and easy way to get important information, interesting facts, or random pieces of knowledge out to many people all over the world. These graphics end up being shared all over the web because of how neat they are, and how they solve problems some people didn't even know they had.
These cool guides and interesting infographics cover everything from the best way to use garlic to how to be a great salesman. Enjoy learning something new and mastering life with these neat facts and cool statistics.
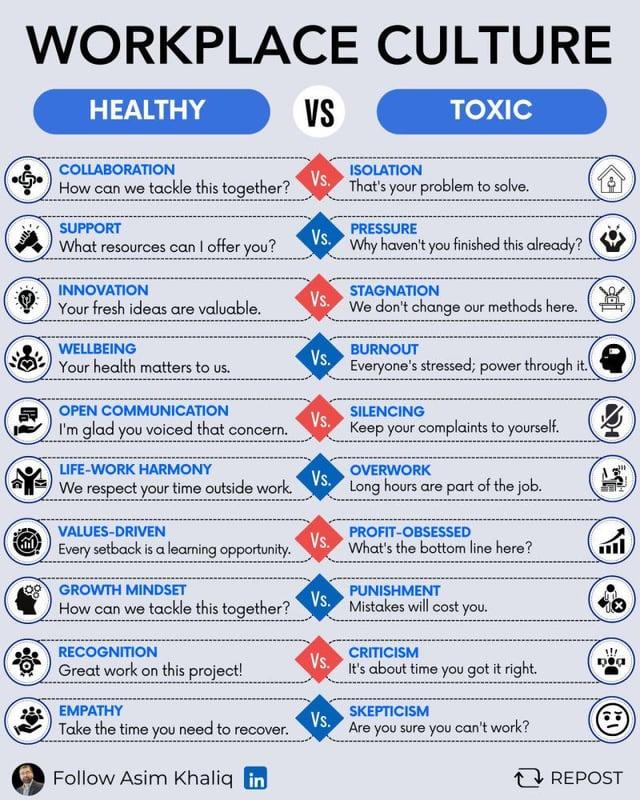
Healthy vs toxic workplace culture

(Source: Reddit)
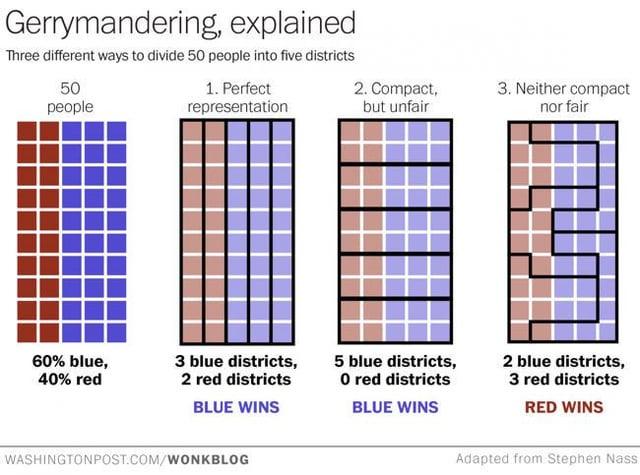
A visual representation of Gerrymandering
(Source: Reddit)
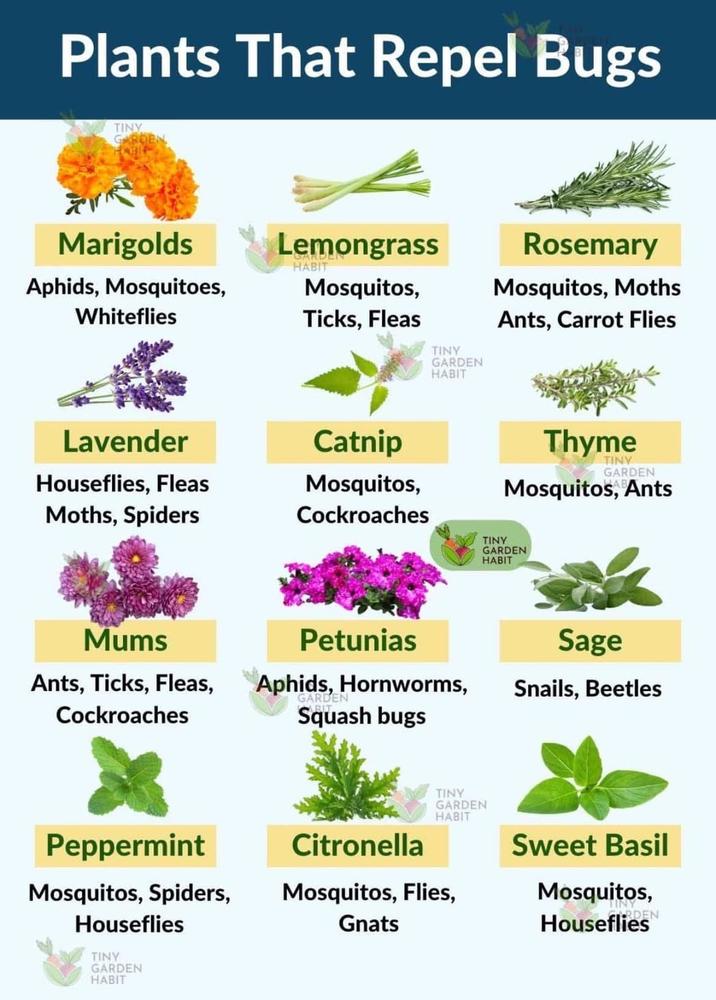
Plants that repel bugs
(Source: Reddit)
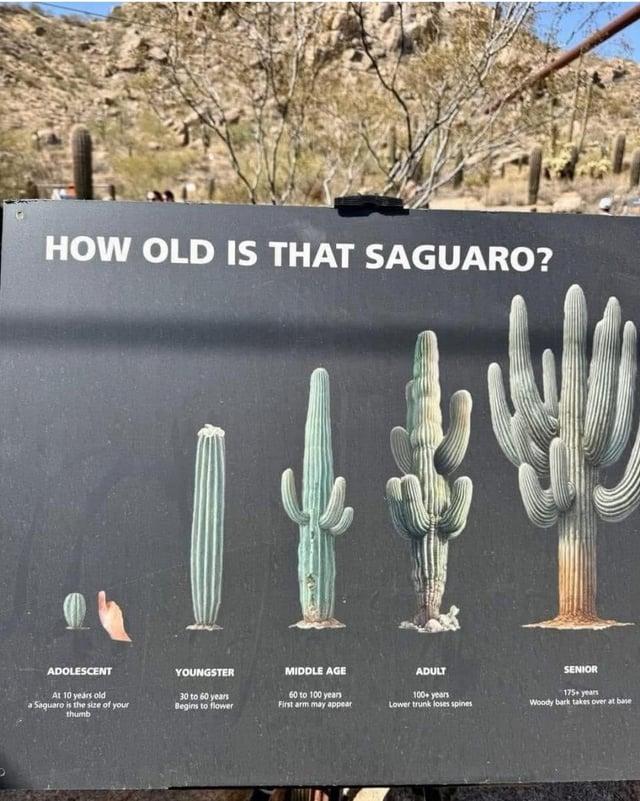
How old is that Saguaro?
(Source: Reddit)
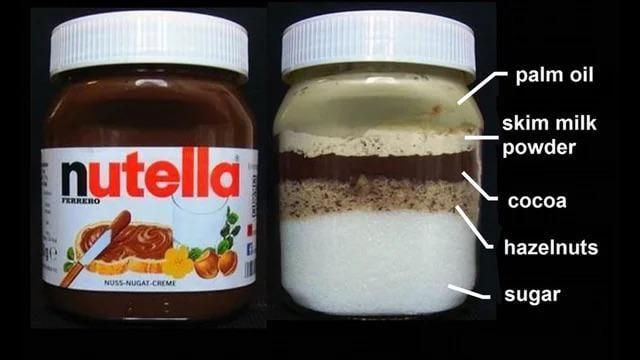
The contents of Nutella
(Source: Reddit)
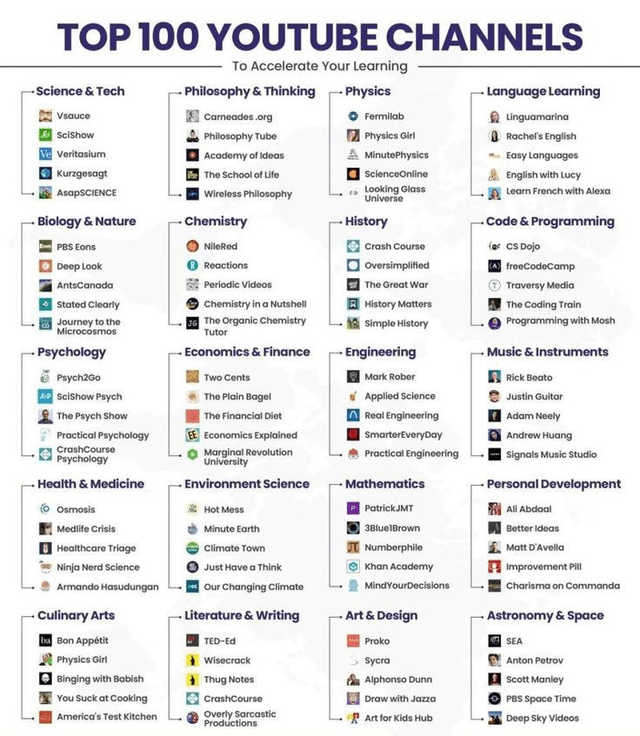
Top 100 Youtube channels
(Source: Reddit)
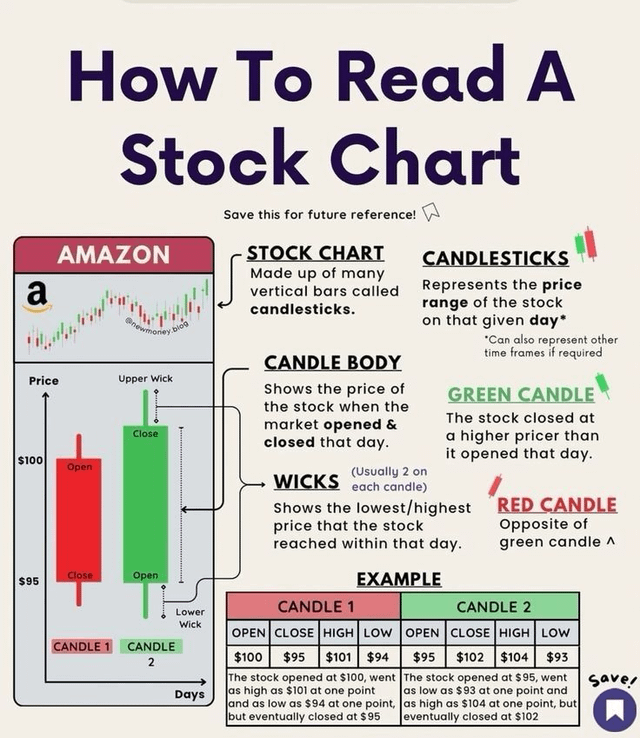
How to read a stock chart
(Source: Reddit)
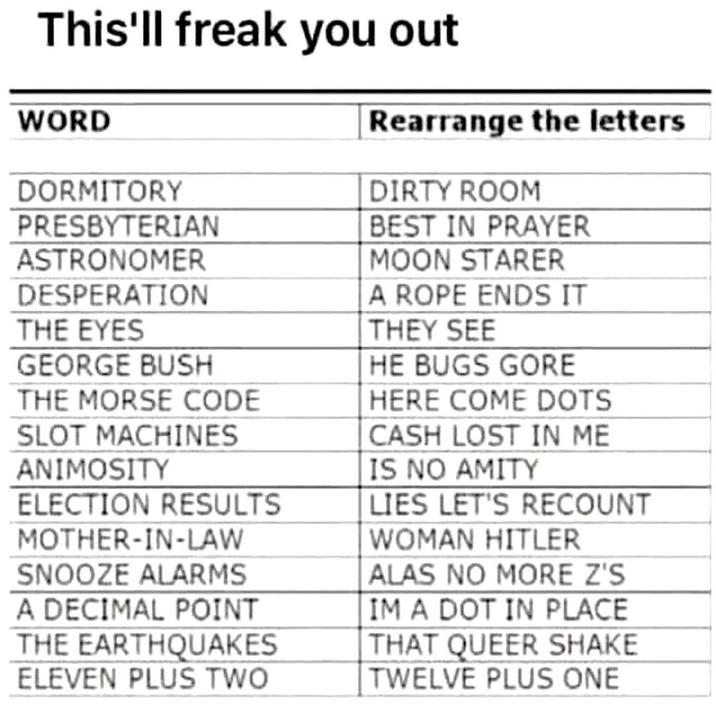
Some cool anagrams
(Source: Reddit)
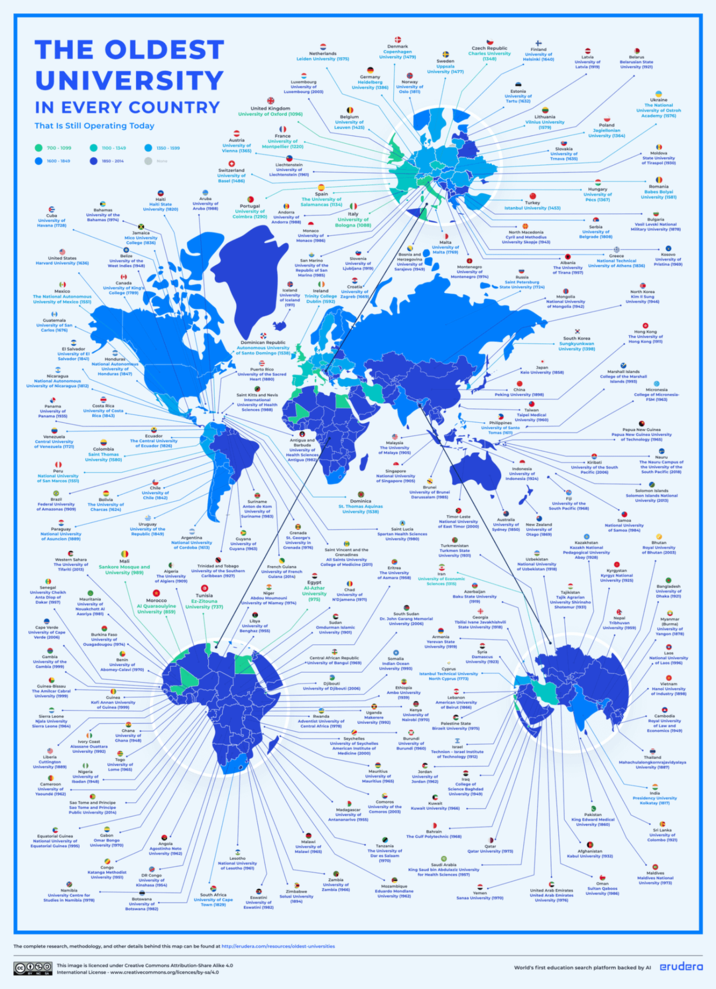
The oldest universities
(Source: Reddit)
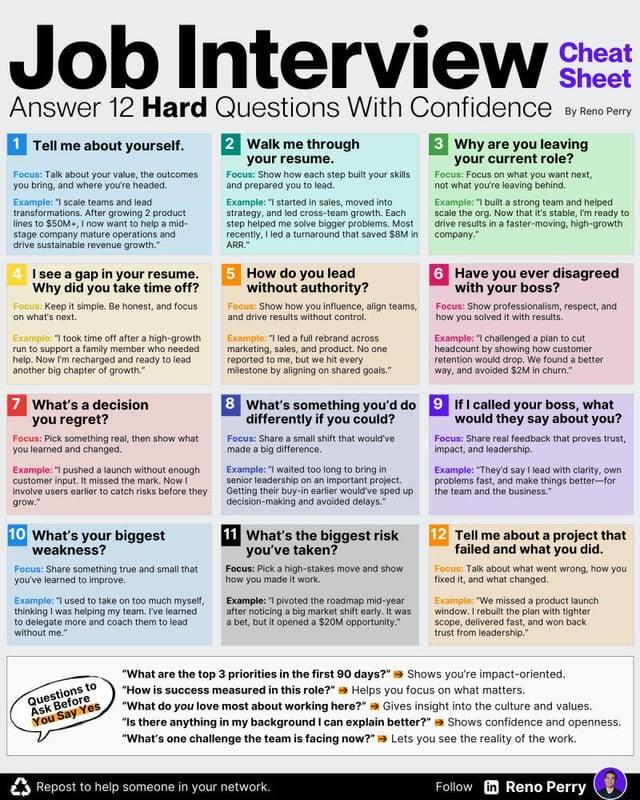
Answering 12 tough interview questions
(Source: Reddit)
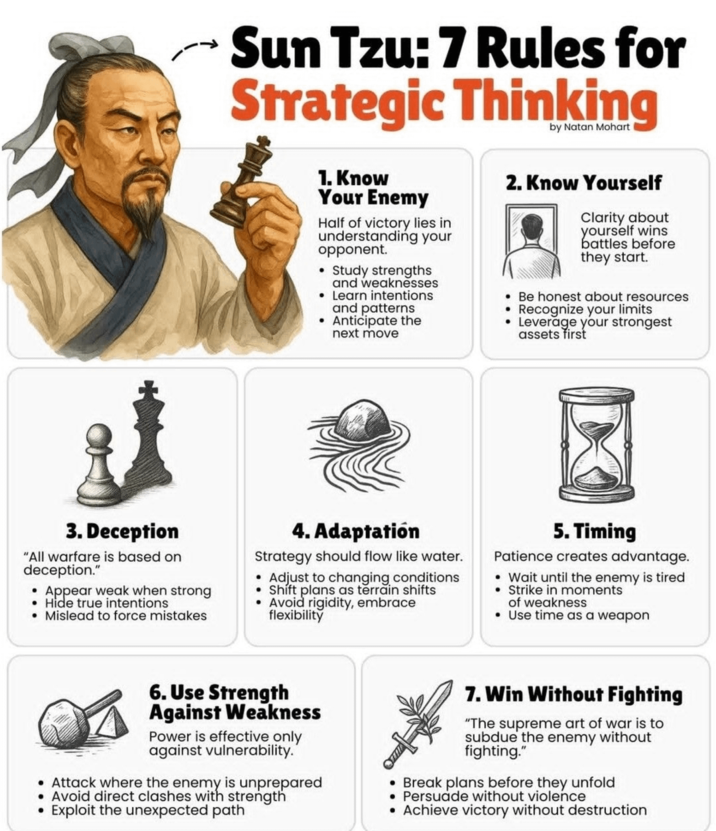
Sun Tzu's rules
(Source: Reddit)
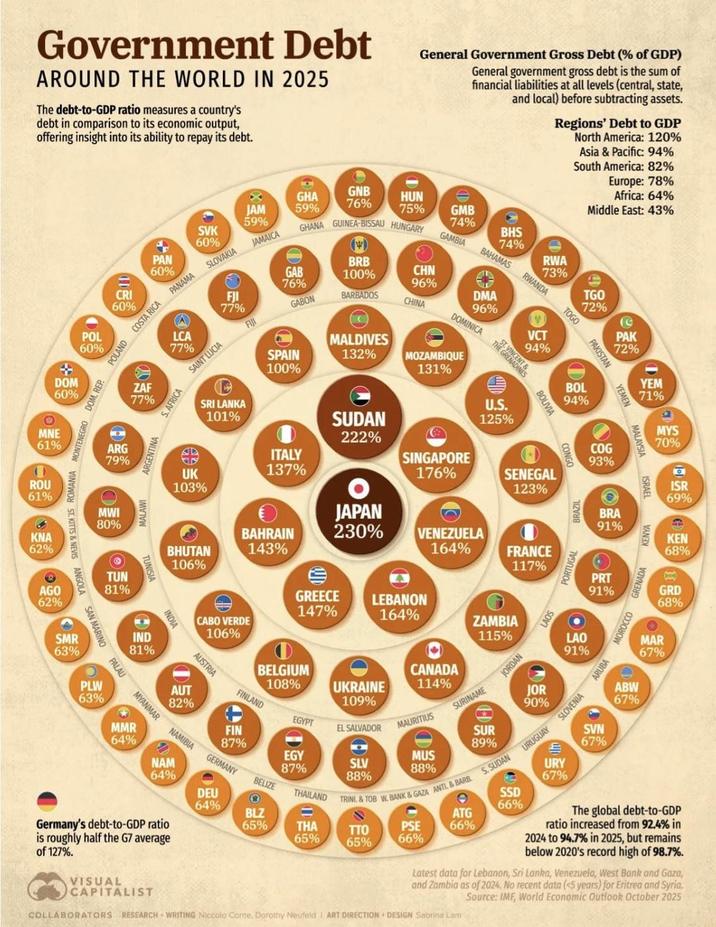
Government debt around the world
(Source: Reddit)
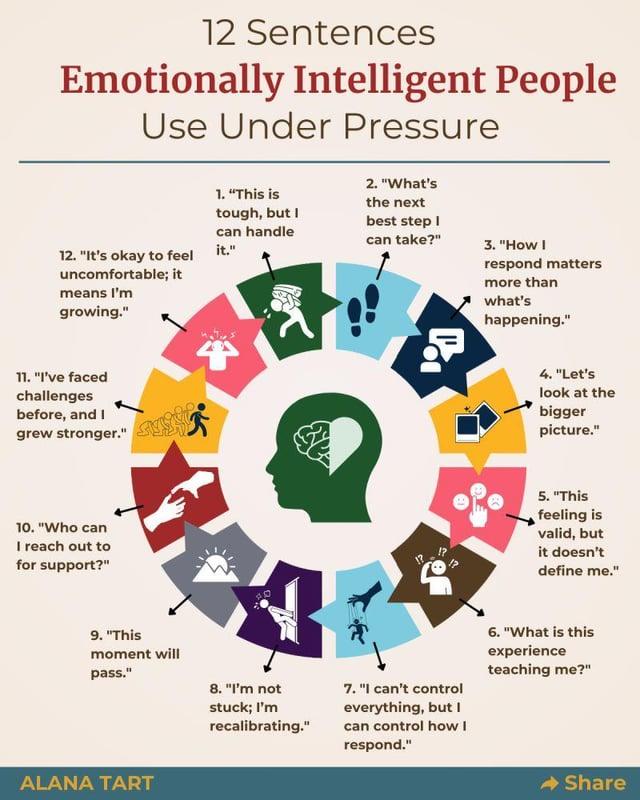
12 phrases to help navigate stress
(Source: Reddit)
Filtering water in emergencies
(Source: Reddit)
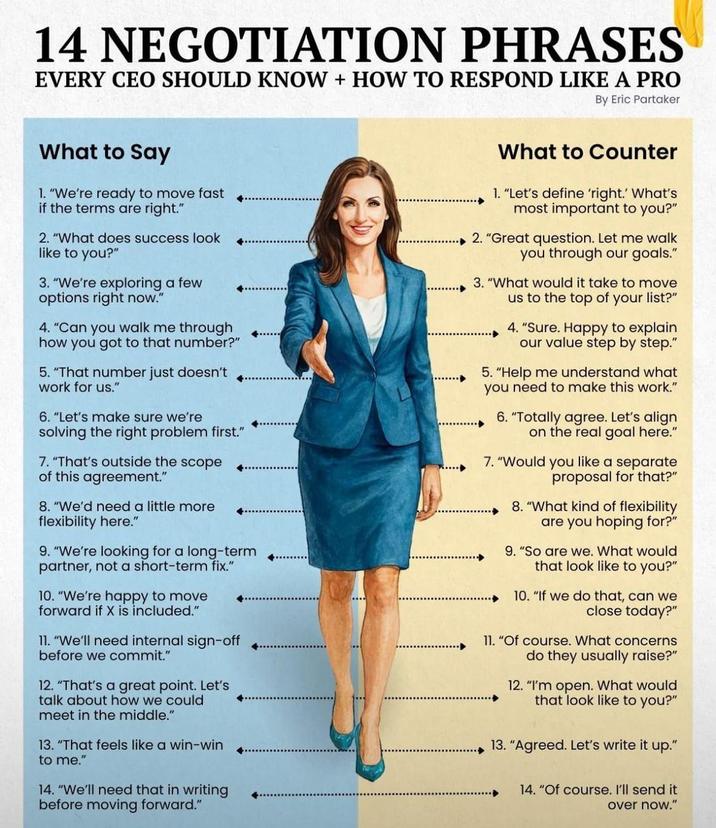
Negotiation phrases
(Source: Reddit)
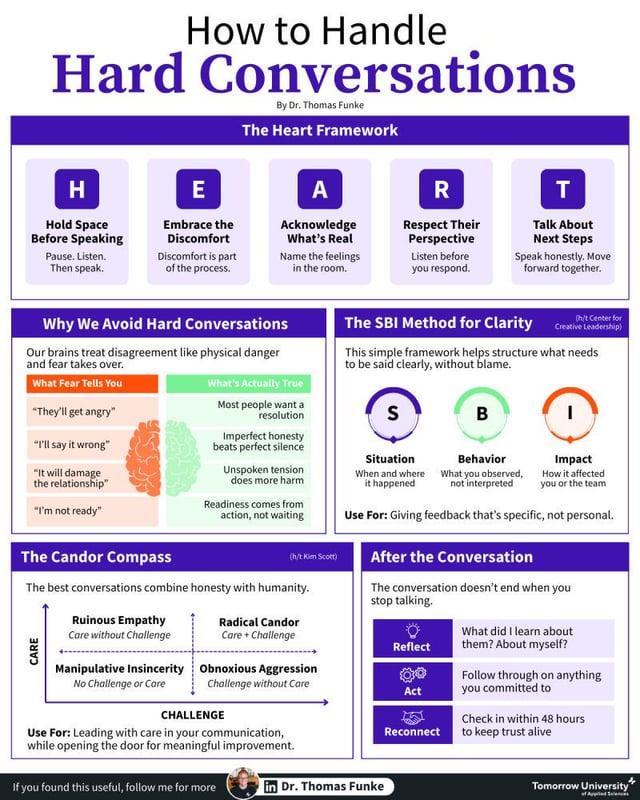
Handling hard conversations
(Source: Reddit)
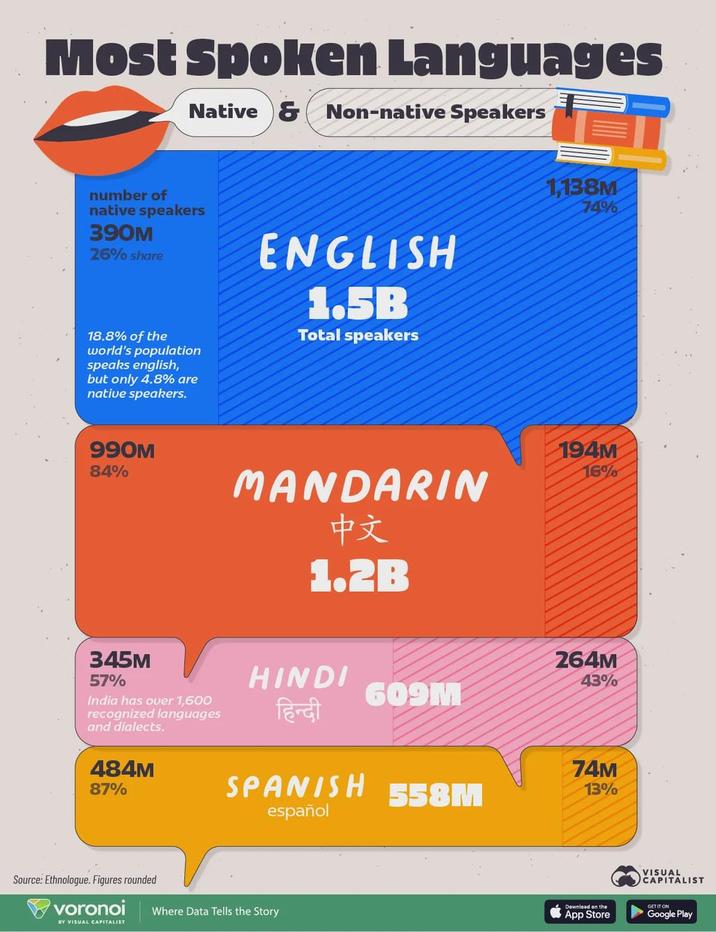
The most spoken languages
(Source: Reddit)
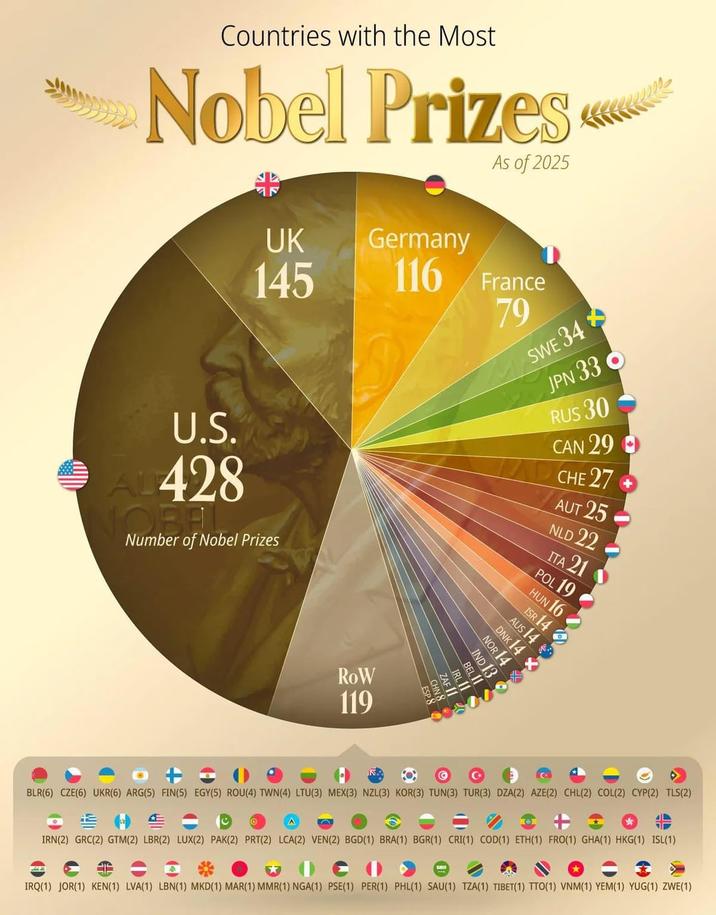
Countries with the most Nobel prizes
(Source: Reddit)
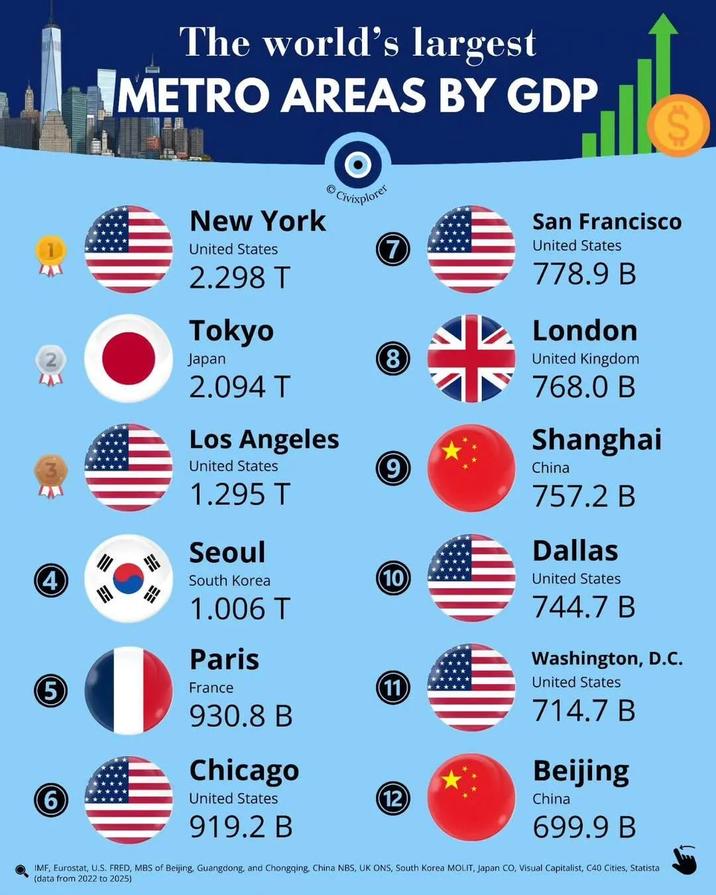
The world's largest metro areas by GDP
(Source: Reddit)
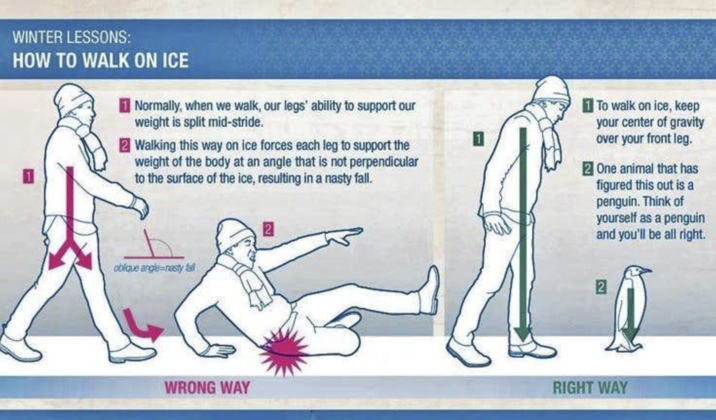
A guide to walking on ice
(Source: Reddit)
How to spin a basketball
(Source: Reddit)
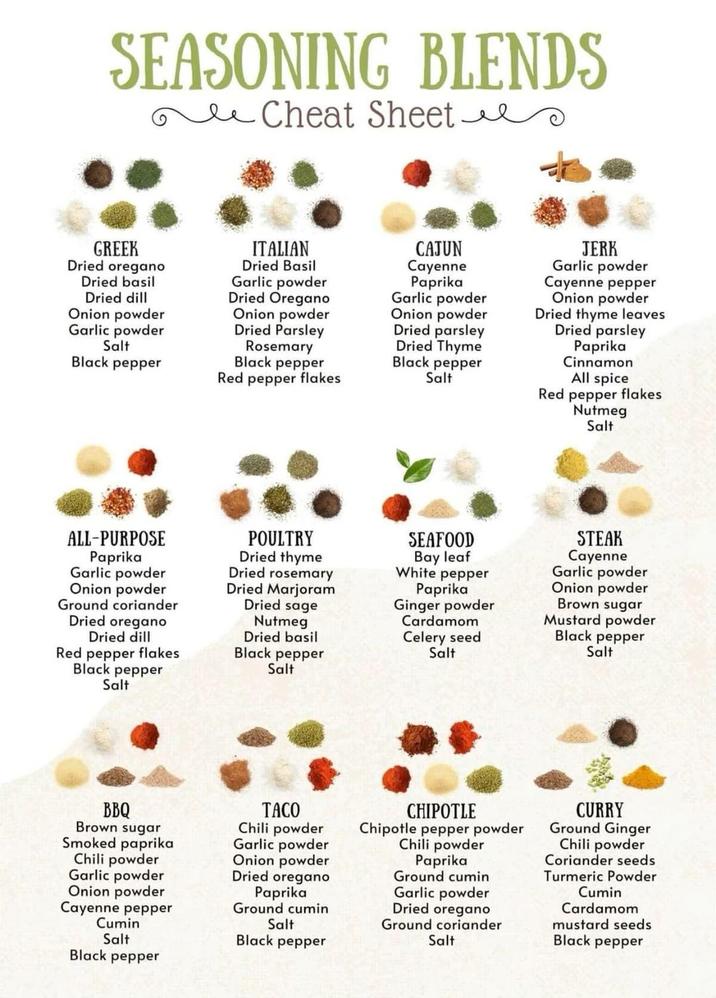
Seasoning blends
(Source: Reddit)
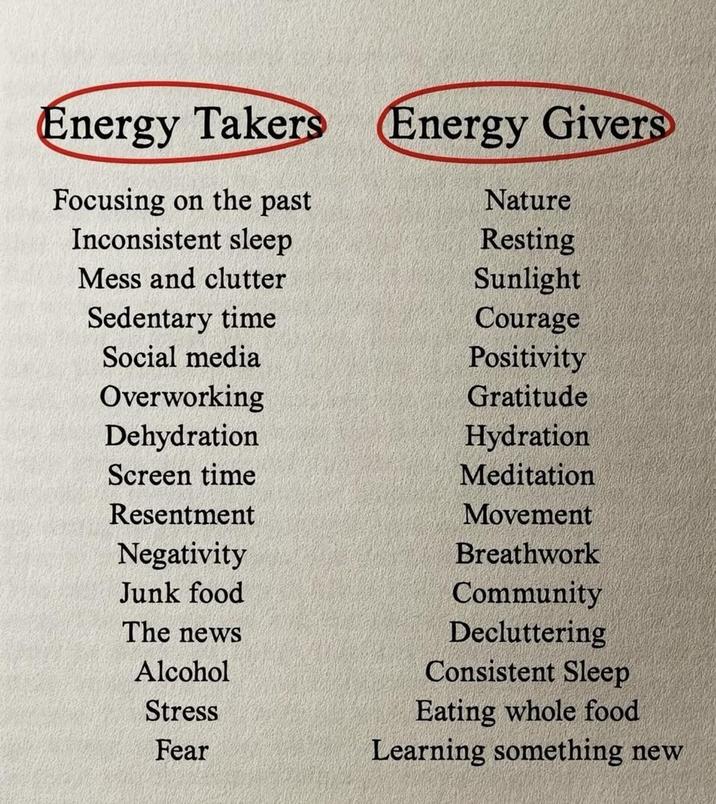
Energy givers and takers
(Source: Reddit)
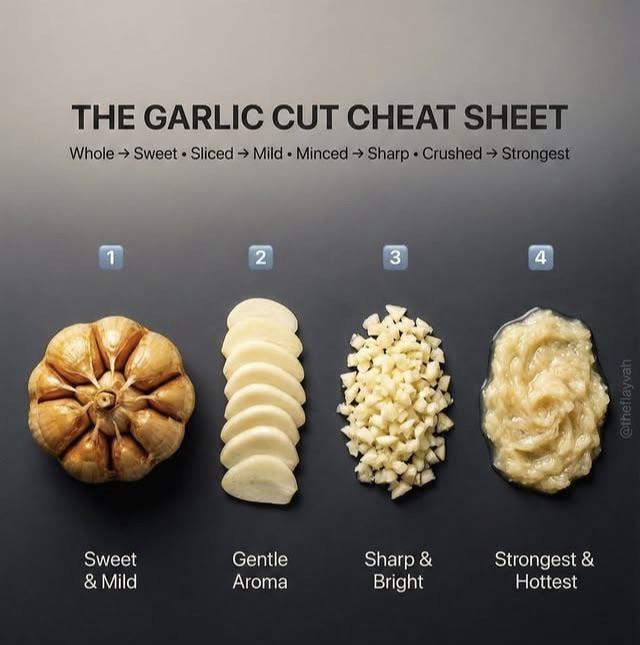
A guide to garlic
(Source: Reddit)